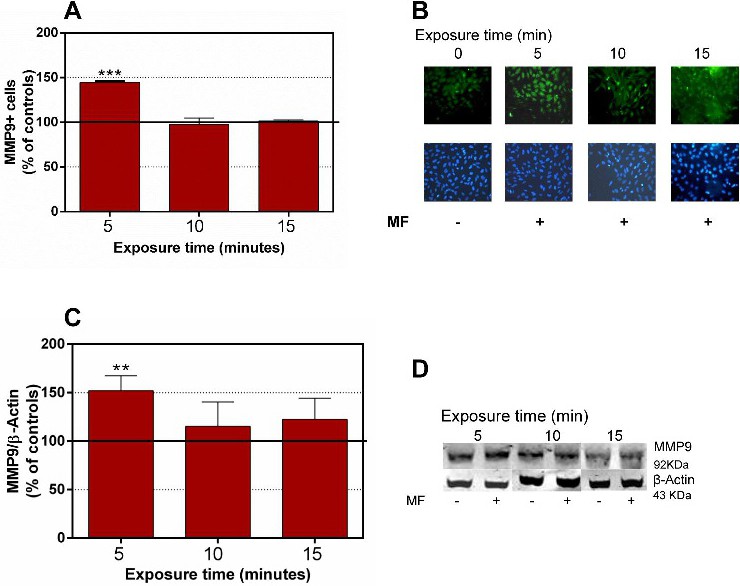
Fig. 6. Rate of MMP-9+ cells and MMP-9 protein expression after 5, 10 or 15 minutes of MF exposure. (A) Immunofluorescence quantification of MMP-9+ cell rate by computer-assisted analysis of photomicrographic images. Bars are means ± SEM of 4 experimental replicates, with 4 samples per experimental condition (sham- or MF-exposure), exposure time and replicate. Data are normalized over controls. ***: p <0.001 (Student's t-test). (B) Upper panel: representative images of MMP-9 labeling in sham-exposed controls (MF-) and in samples exposed to the field (MF+) for -5, -10 or -15 minutes. Lower panel: Hoechst staining of the corresponding nuclei. (C) Western blot analysis of MMP-9 expression, using β-Actin as charge control. Normalized data. Bars are means ± SEM of 6 experimental replicates, with 3 samples per experimental condition (sham- or MF-exposure), exposure time and replicate. **: 0.001 ≤ p<0.01 (Student's t-test). (D) Representative blots at the different time intervals; MF+: field-exposed samples; MF-: sham-exposed controls.